
Phytoplankton, the single-celled plants of the sea, are the basis of the oceanic food web – and every organism that lives in the sea ultimately depends upon the photosynthesis of phytoplankton to survive! This includes the Southern Bluefin Tuna – while their first feeding stages may only DIRECTLY eat few phytoplankton, what they DO eat depends upon phytoplankton as a food source, linking phytoplankton to fish.
As part of our greater effort to characterize the ecosystem during BLOOFINZ, my role is to count the phytoplankton in our study area. Phytoplankton abundance varies in space, both horizontally and vertically in the ocean. Because they require light for photosynthesis, more phytoplankton are generally found nearer to the surface of the ocean, but they span the depth range where light penetrates – on this expedition, that has been to about 80-100 m in most areas. So, we have been taking samples for phytoplankton from our underway (surface) seawater system, as well as from many depths in the lit layer of the ocean using the CTD-bottle casts (when we could!).
To count the phytoplankton, I am using a machine called a “flow cytometer” – this uses lasers to “light up” the individual phytoplankton cells, which are then counted one-by-one. With the flow cytometer, we can process samples quickly – on this cruise, to date, >1500 individual samples have been analyzed (Figure 1).
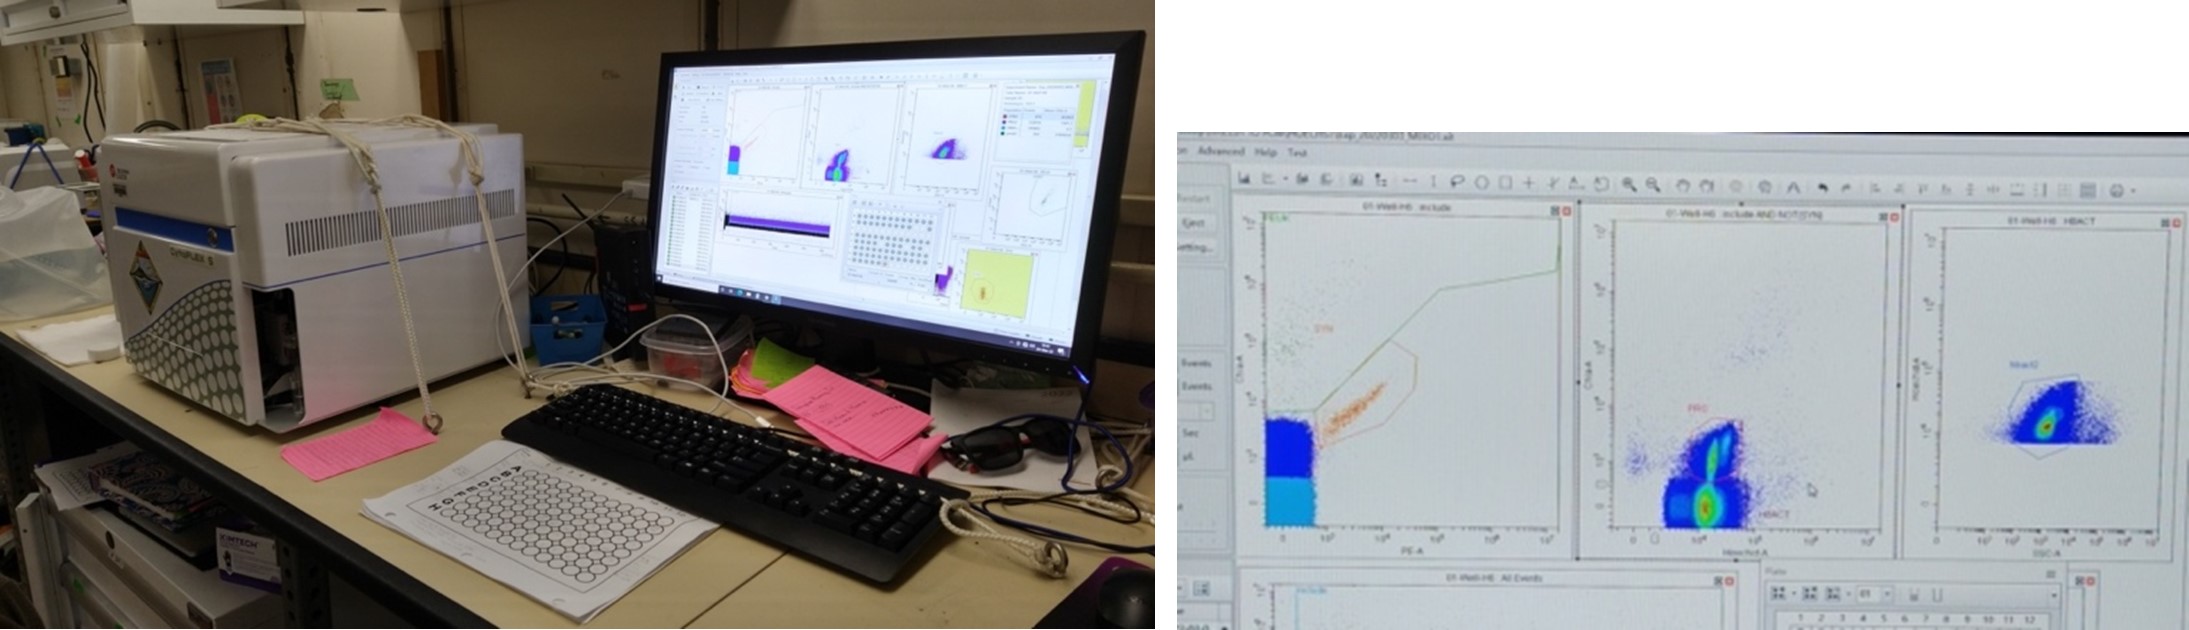
Figure 1. Flow cytometer (left) for counting phytoplankton and bacteria; along with data output (right).
From this machine, we can divide up the phytoplankton into groups – the two most common groups in these low-nutrient waters are both cyanobacteria – Prochlorococcus and Synechococcus. Larger phytoplankton are also present, but at lower abundances and this method of counting them doesn’t allow us to know “who” (which species) they are – nevertheless, we get a total count for the whole phytoplankton community with the flow cytometer. In addition to the phytoplankton, we also count the bacteria in our samples – every drop of water in the sea has about a million of these as well!
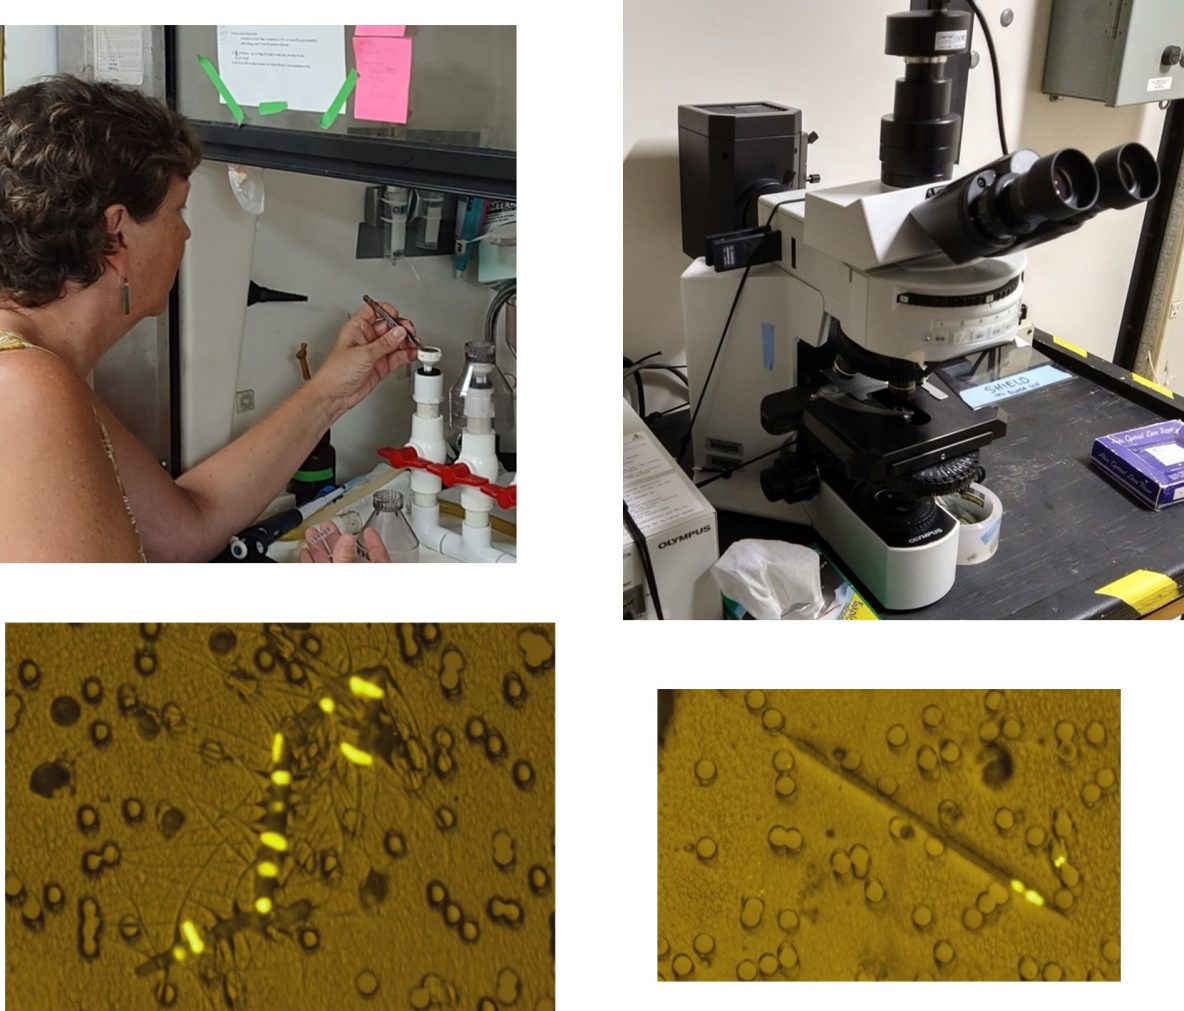
In addition to counting phytoplankton out here, I am also helping to prepare samples that will be used (back on shore) to determine “who” the larger phytoplankton are in our study area. In contrast to flow cytometry, the method we use for this involves using a MICROSCOPE! Despite all the advances in technology and fancy machines we have, we still rely on microscopes to get information on the community that is not possible other ways. This is because an ocean sample can be gently concentrated and stained with various dyes to light up cell components (like DNA and protein) and, when viewed under the microscope, our eyes can discern who and what better than most automated particle counting systems. Of great interest so far, has been the occurrence of diatoms with symbiotic cyanobacteria that fix elemental nitrogen (N2) in surface waters (Figure 2).

Figure 2. Top left: Karen making microscope slide; Top right: On-board fluorescence microscope. Bottom images: Diatoms with nitrogen (N2)-fixing symbionts inside. The symbionts are bright yellow in these pictures and the diatoms associated with them are Chaetoceros sp. (left) and Rhizosolenia (right). The dark circles are the 8-µm diameter holes in the filter the sample was concentrated on.